Professional Trader
40K+
10K+
500+
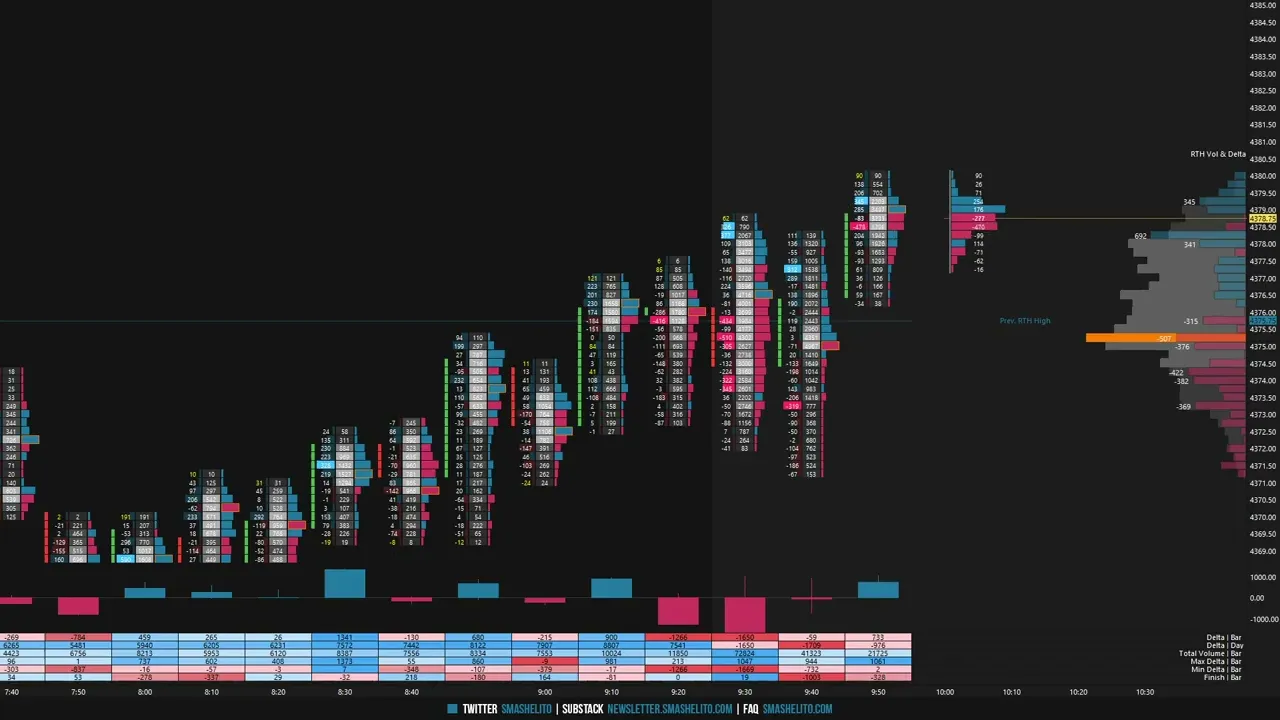
Navigating the Auction Process with Market Profile & Orderflow
Free Substack · Join 10,000+ traders
Private Substack · Launching soon: Request invite
Now Available For Purchase
Get in touch · smashelito@gmail.com